Live Example
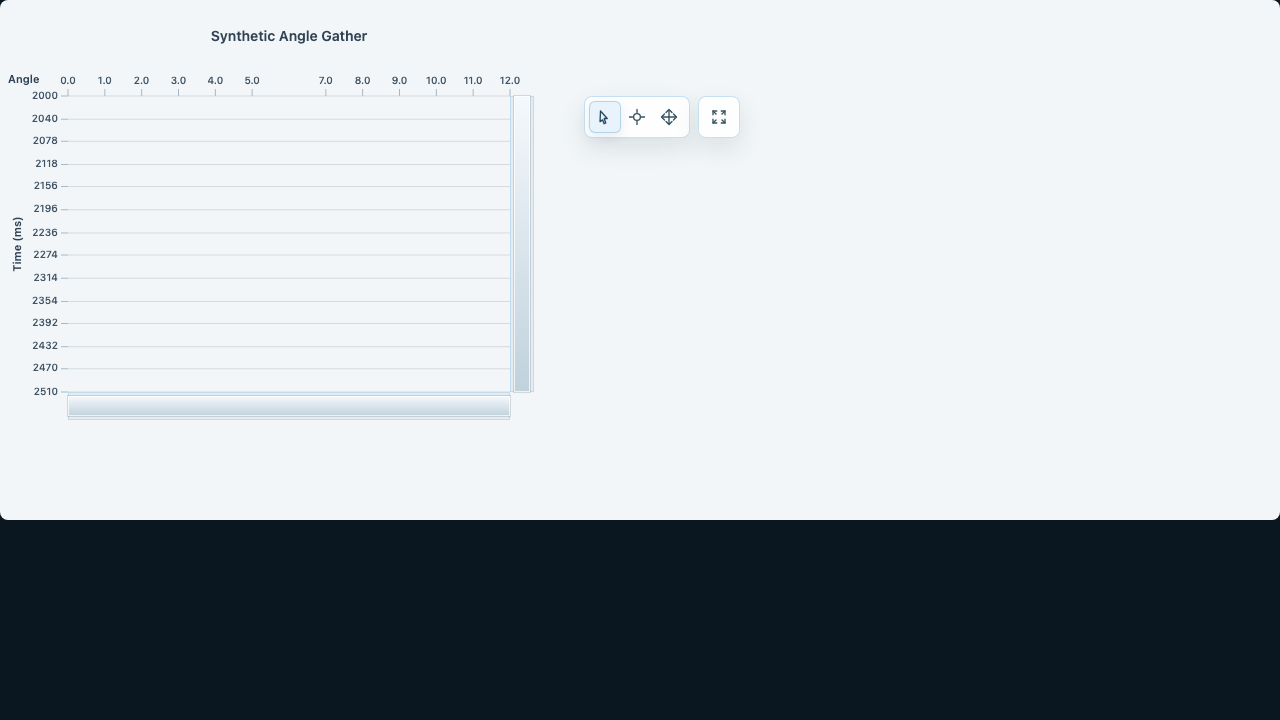
Prestack Gather
A focused gather surface over the same seismic interaction model, tuned for trace-by-trace exploration.
Examples
These examples are the public demonstration layer for the current commercial rollout. They focus on the chart families that already have clear wrapper boundaries, purposeful controls, and matching docs.
Launch Family
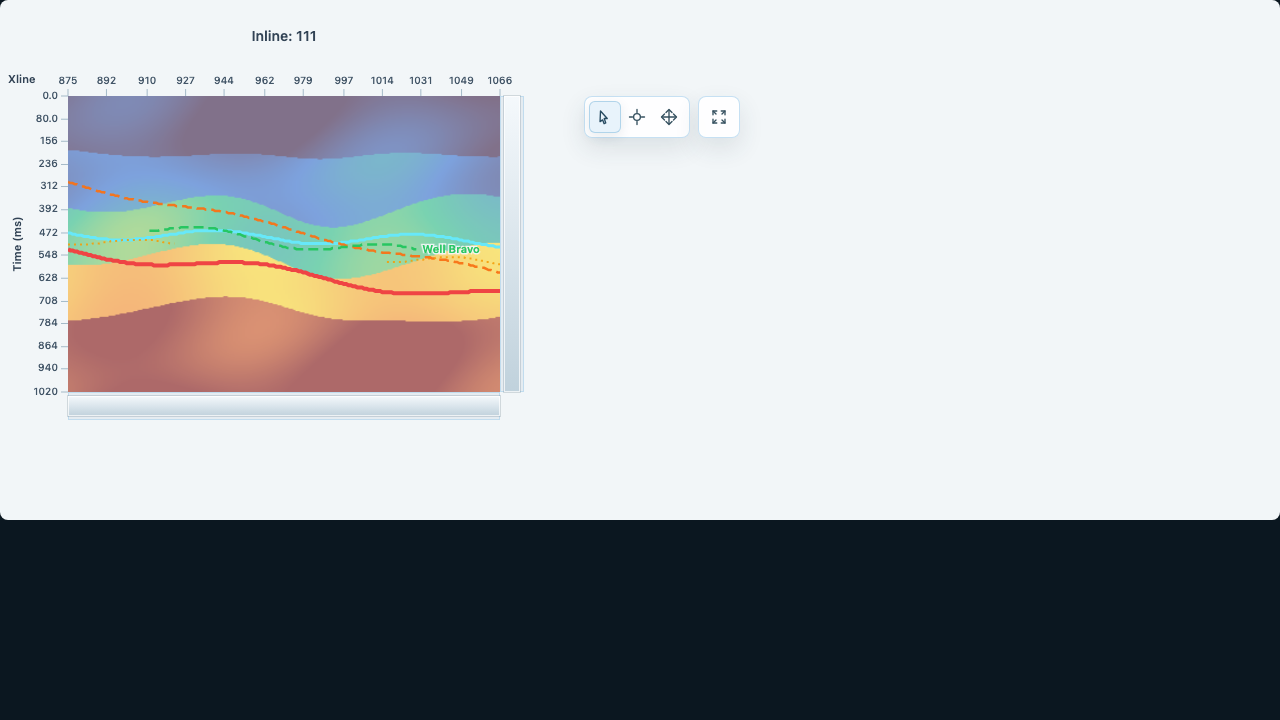
Shared viewport control, probes, overlays, and heatmap or wiggle presentation for section-first interpretation tooling.
Live Example
A focused gather surface over the same seismic interaction model, tuned for trace-by-trace exploration.
Live Example
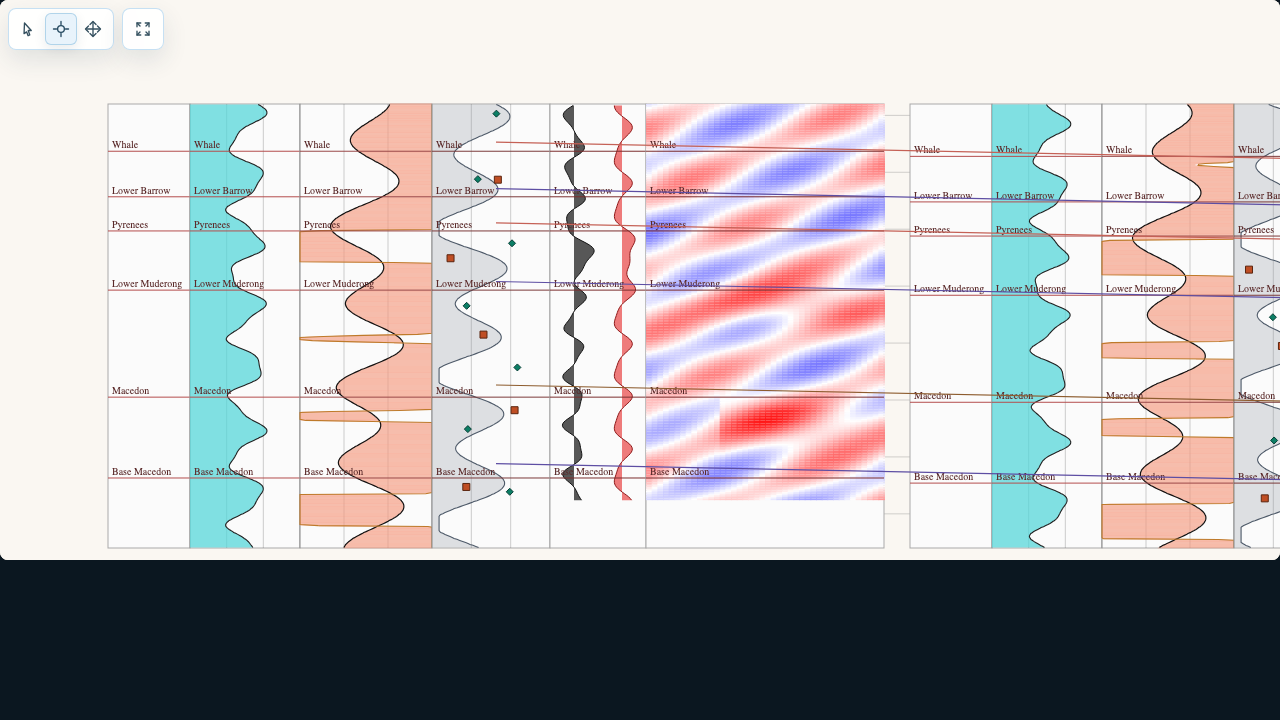
Depth-aligned multi-well layouts with explicit panel semantics instead of generic dashboard abstractions.
Live Example
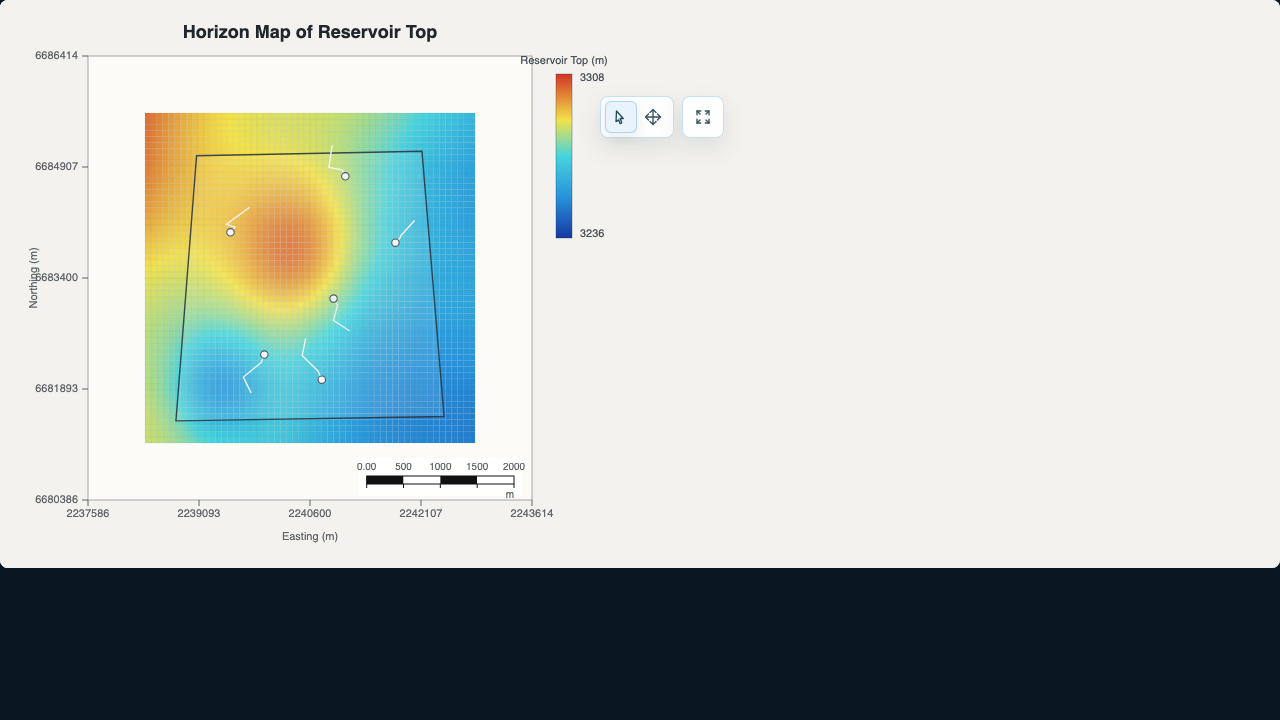
Plan-view context for wells, trajectories, outlines, and geospatial overlays that belong beside scientific data.
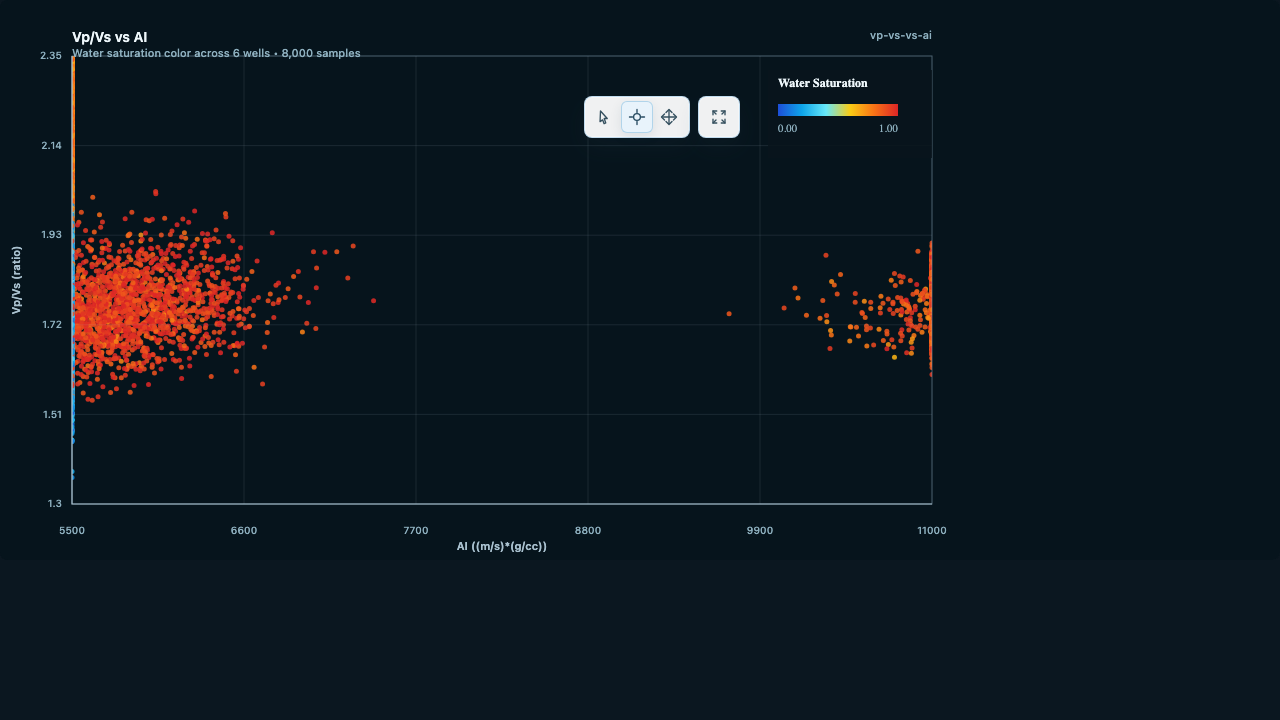
Live Example
Dense point-cloud interaction with typed models and host-owned axis workflows for scientific applications.
Evaluation Use
The gallery is there to make scanning faster. The real evaluation step is still the live example plus the matching docs page for the wrapper and chart family you care about.