Launch Family
Seismic Section
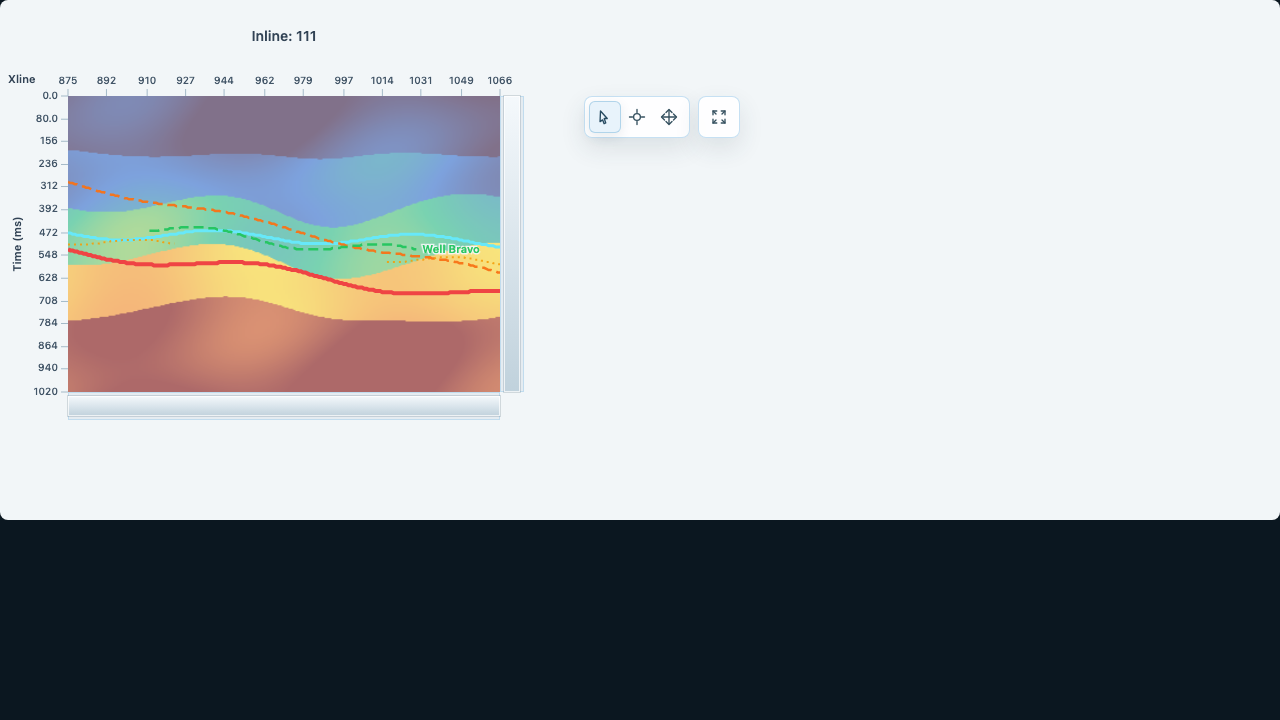
Shared viewport control, probes, overlays, and heatmap or wiggle presentation for section-first interpretation tooling.
Commercial Scientific Charting
Ophiolite Charts is a focused commercial chart library for subsurface and scientific workflows, with live launch examples, typed wrappers, and a documentation surface built around real integration work.
Launch Families
The launch story is intentionally narrow. Instead of pretending to cover every chart category, the site centers on the families that already have real product value and clear documentation paths.
Launch Family
Shared viewport control, probes, overlays, and heatmap or wiggle presentation for section-first interpretation tooling.
Launch Family
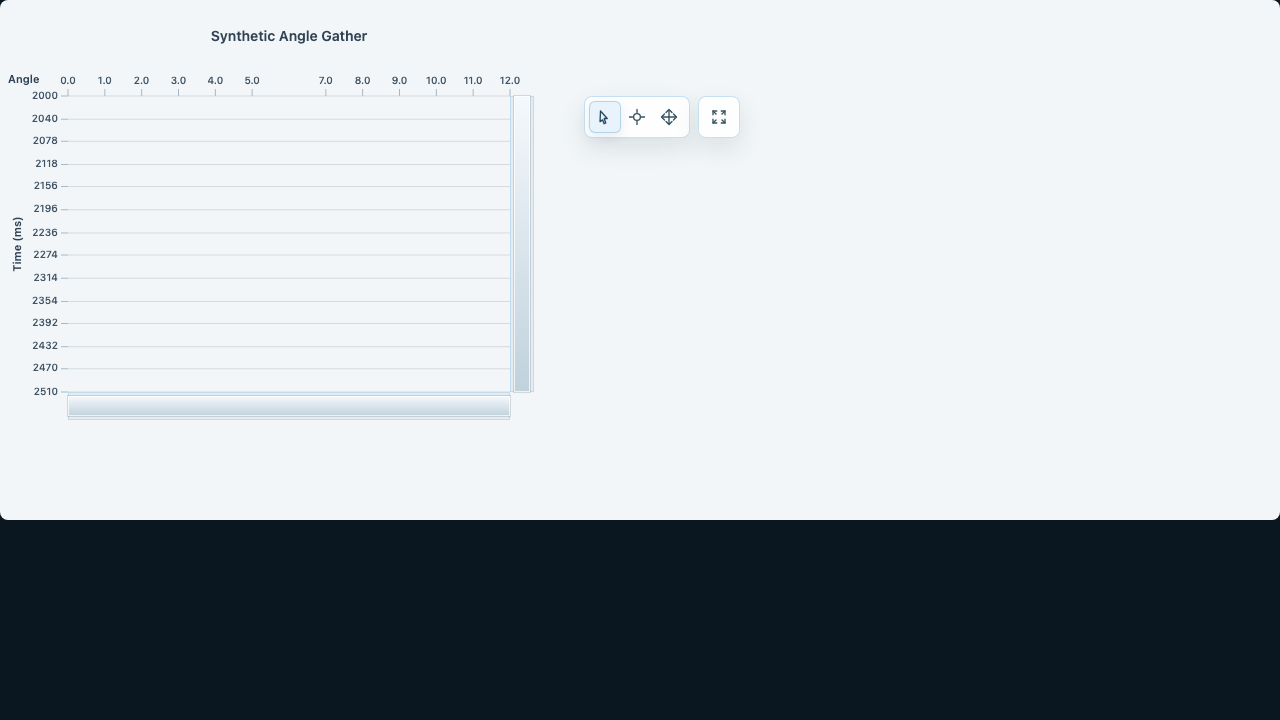
A focused gather surface over the same seismic interaction model, tuned for trace-by-trace exploration.
Launch Family
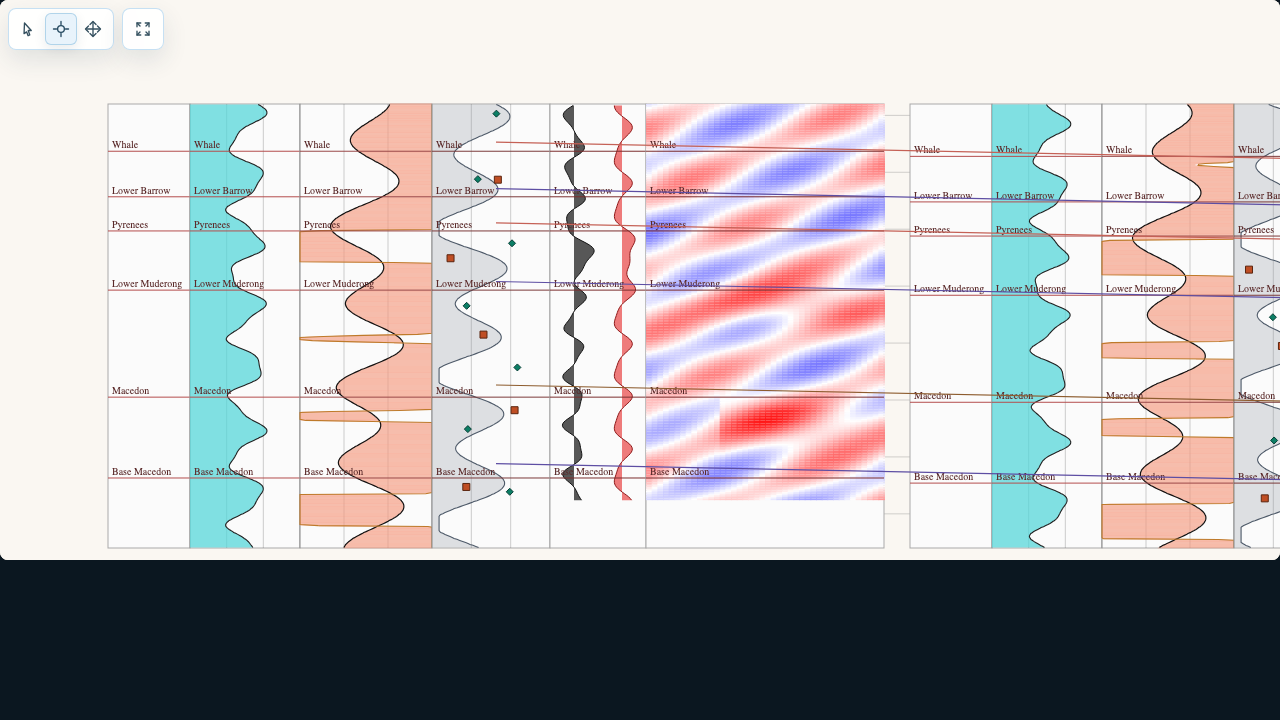
Depth-aligned multi-well layouts with explicit panel semantics instead of generic dashboard abstractions.
Launch Family
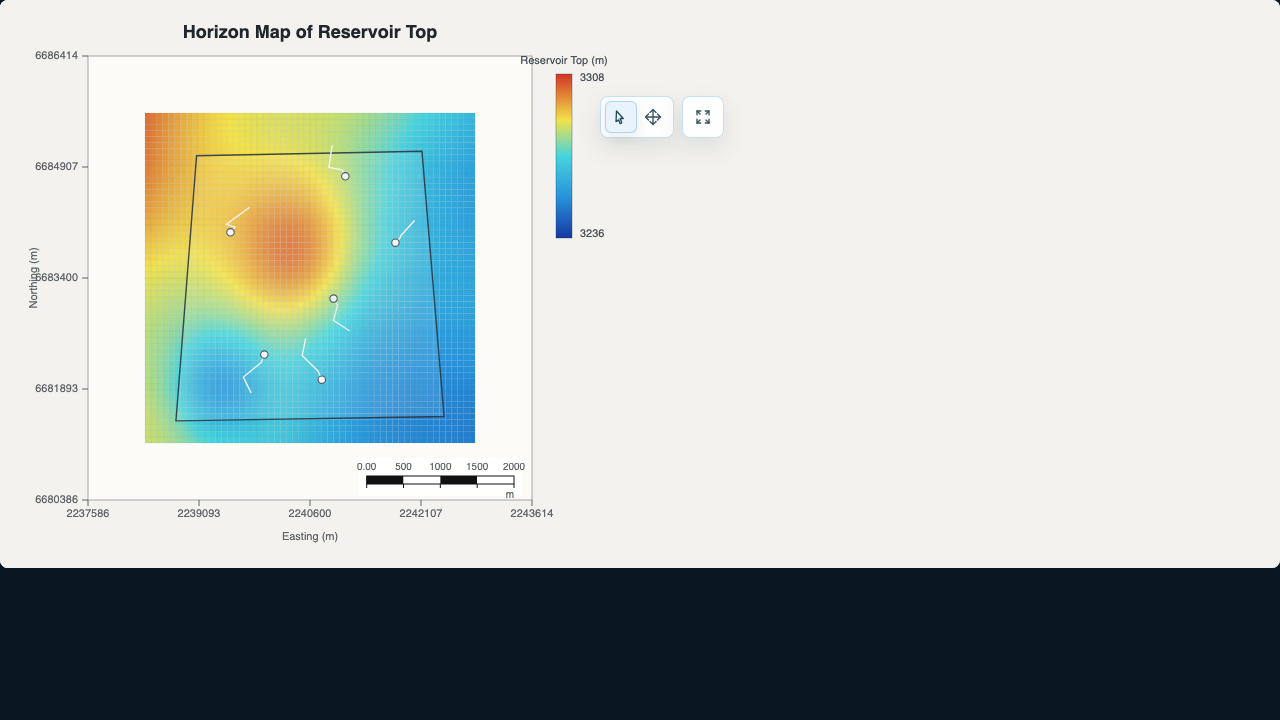
Plan-view context for wells, trajectories, outlines, and geospatial overlays that belong beside scientific data.
Launch Family
Dense point-cloud interaction with typed models and host-owned axis workflows for scientific applications.
Why Teams Buy
Every primary CTA can lead to a runnable chart, not just a screenshot wall or feature list.
The current public surface is explicit about what belongs to the wrapper, what belongs to the host app, and what is still early access.
Scientific workflows need probes, overlays, and chart-specific actions that generic BI libraries rarely model cleanly.
Evaluation, team licensing, and enterprise support sit in the product story from day one instead of being bolted on later.
Integration
<SeismicSectionChart
  chartId="section-demo"
  section={section}
  viewport={viewport}
  onViewportChange={({ viewport }) => {
    currentViewport = viewport;
  }}
/>import { SeismicSectionChart } from "@ophiolite/charts";
const chart = new SeismicSectionChart({
target,
props: {
chartId: "section-demo",
section,
viewport
}
});Live Launch Examples
Live Example
Shared viewport control, probes, overlays, and heatmap or wiggle presentation for section-first interpretation tooling.
Live Example
A focused gather surface over the same seismic interaction model, tuned for trace-by-trace exploration.
Live Example
Depth-aligned multi-well layouts with explicit panel semantics instead of generic dashboard abstractions.
Early Access
The immediate goal is a credible product surface: live examples, clear docs, and pricing that matches a serious rollout conversation.